System Maintenance occurs every Friday.
System Maintenance occurs every Friday.
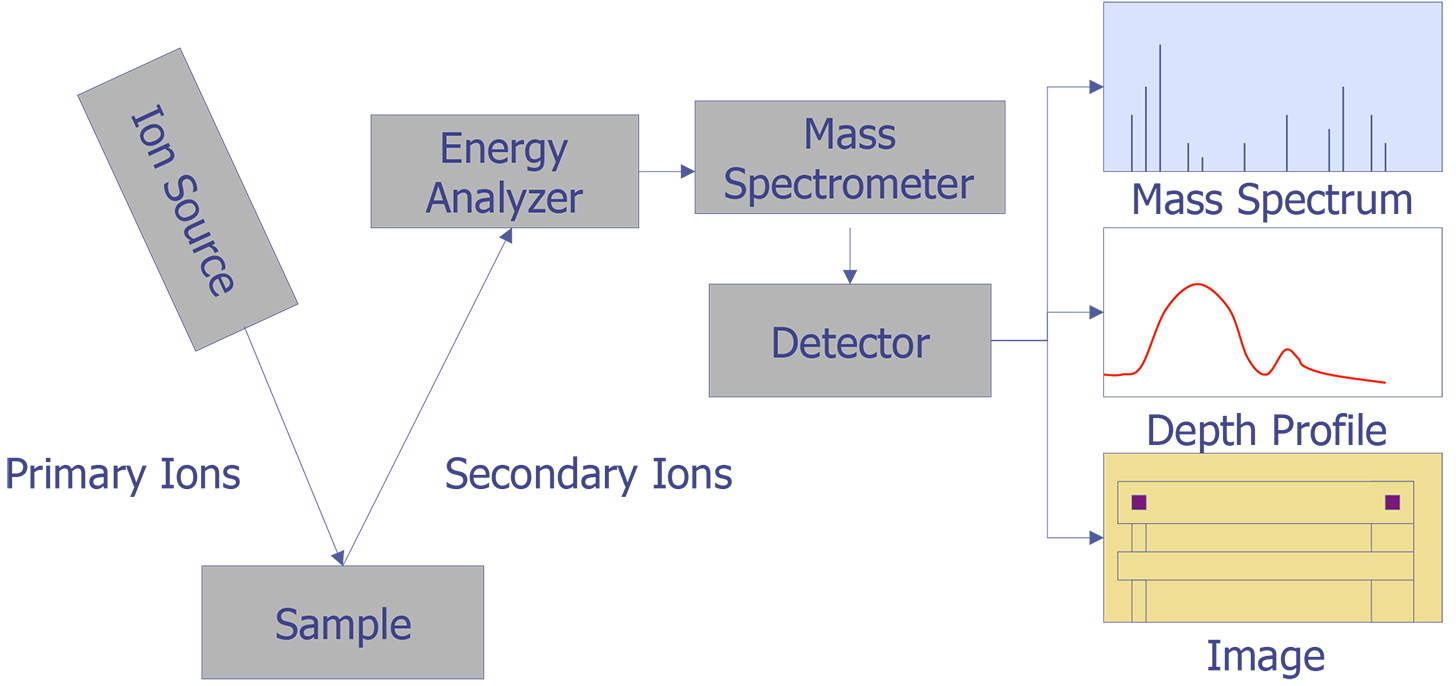
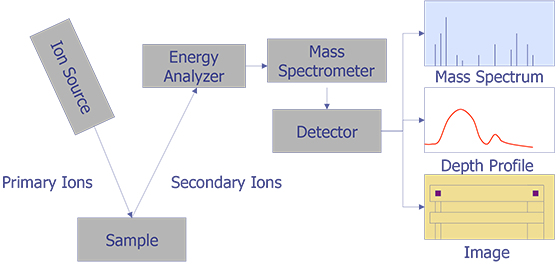
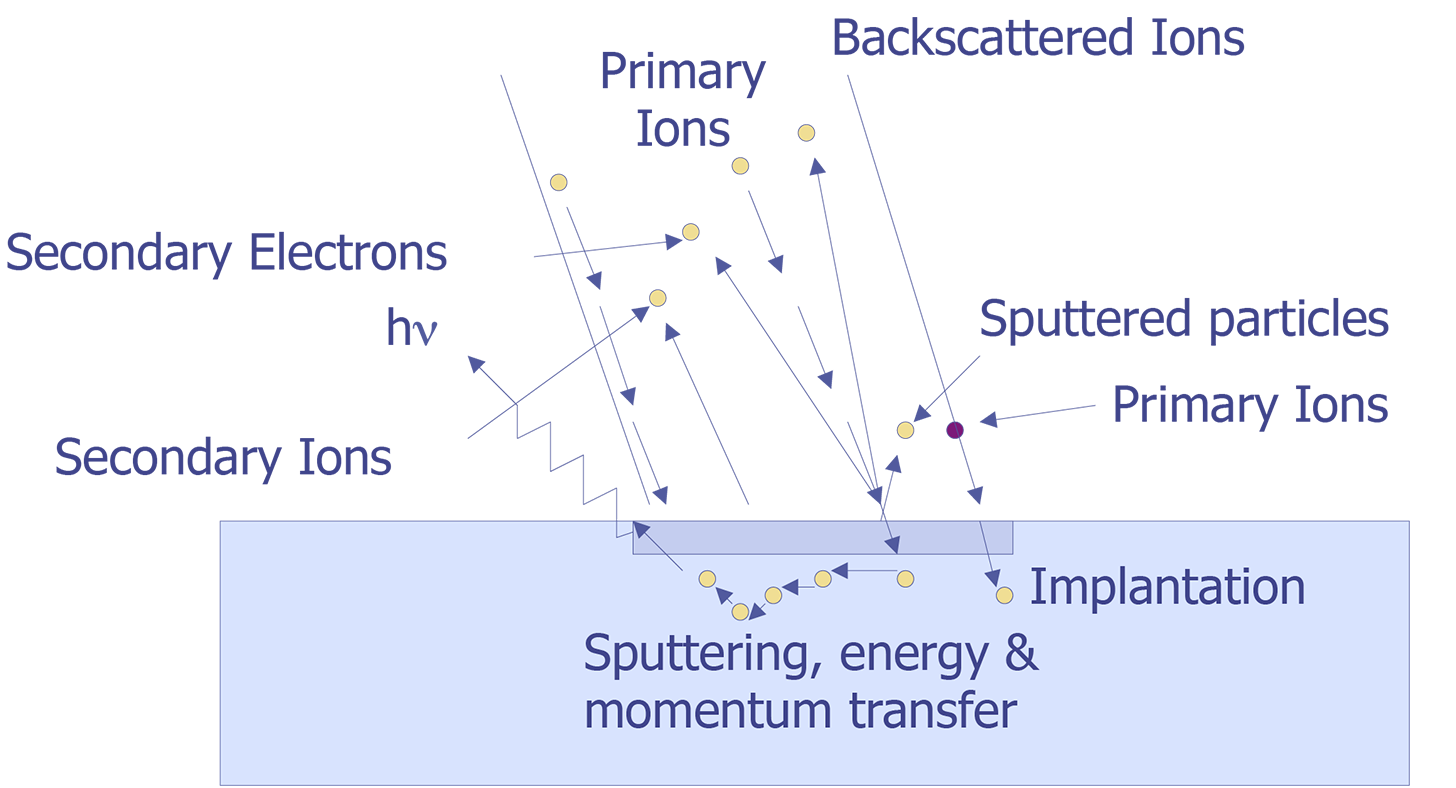
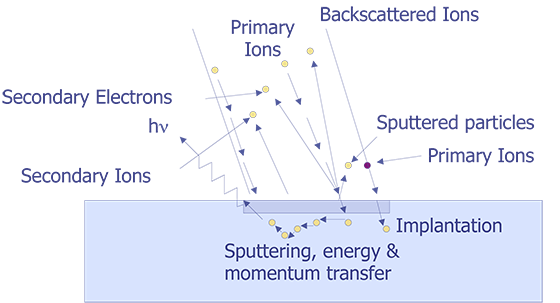
Secondary Ion Mass Spectrometry (SIMS) is an analytical technique that can be used to characterize the surface and near surface (~30 µm) region of solids and the surface of some liquids. The technique uses a beam of energetic (0.5-20 keV) primary ions to sputter the sample surface, producing ionized secondary particles that are detected using a mass spectrometer. Figure 1 illustrates the SIMS method. The primary beam can be O2+, O-, Cs+, Ar+, Xe+, Ga+, or any of a number of other species that have been used successfully for various applications. O2+ is typically used for the detection of electropositive species, Cs+ for electronegative species, and Ga+ for improved lateral resolution. The sample can intercept the primary beam at different angles of incidence, with a typical range from normal to 60° from normal. The sputtering process is not just a surface layer phenomenon, but consists of the implantation of the primary species into the sample and the removal of surface atoms by the energy loss of the primary species in the form of a collision cascade. Many species are formed by the interaction of the beam with the sample, but the positive and negative secondary ions are the species of interest for SIMS. Most of the secondary particles are neutrals and can be detected by post ionization (Secondary Neutral Mass Spectrometry or SNMS). The secondary ions and extracted by electric fields and then energy and mass analyzed. Detection is by electron multiplier, Faraday cup, or ion sensitive image amplifier for imaging.
The basis of ion microprobe SIMS is the use of a focused primary ion beam to erode atoms from a selected region of a sample surface. A portion of the eroded atoms undergo a charge exchange in the near surface environment, resulting in their conversion to negative or positive ions. These secondary ions are then extracted via an electrical potential and subsequently analyzed by a mass spectrometer. SIMS thus yields an analytical technique capable of elemental specificity, with detection limits in the range of ppm-ppb (atomic concentration).
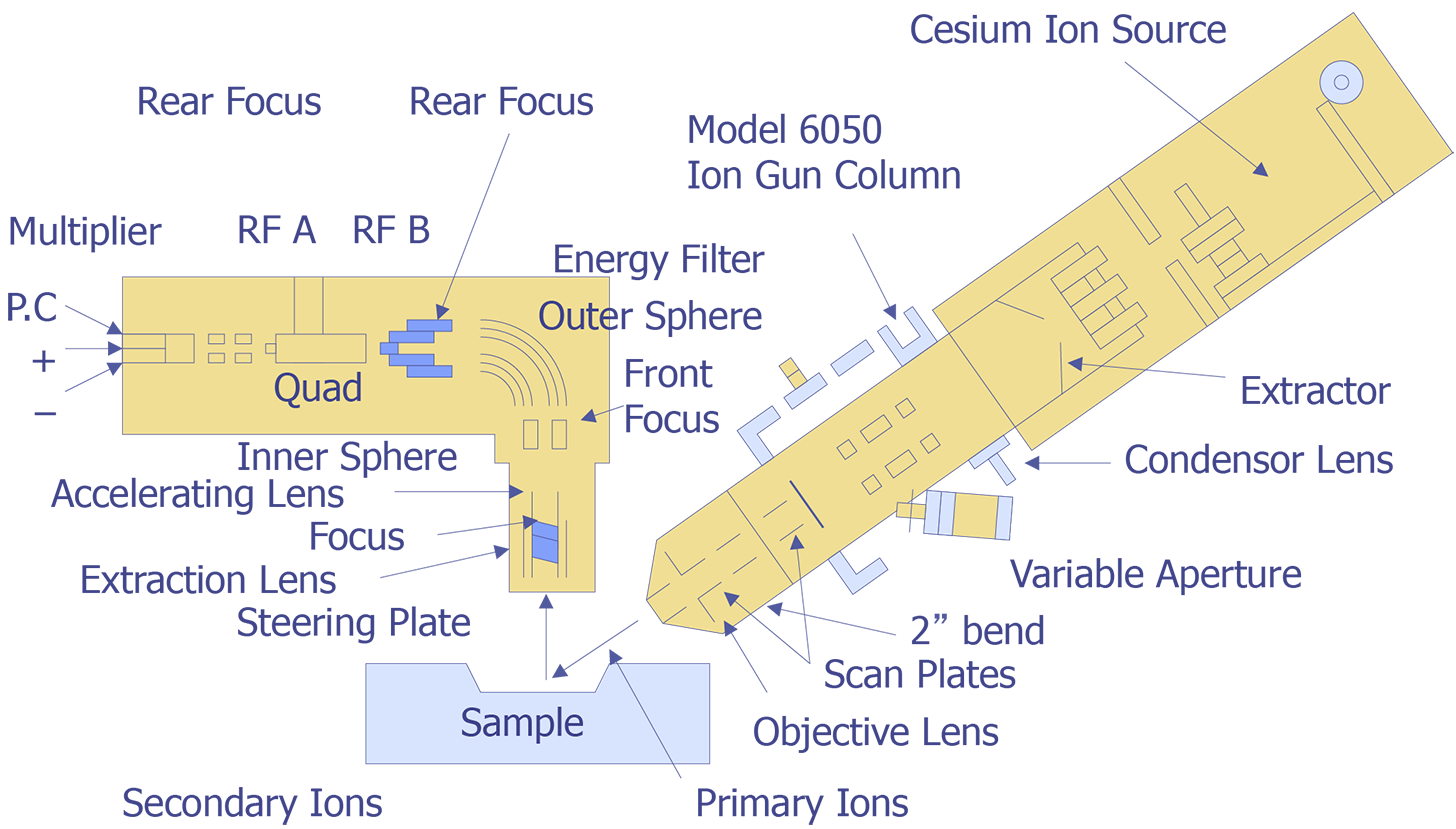
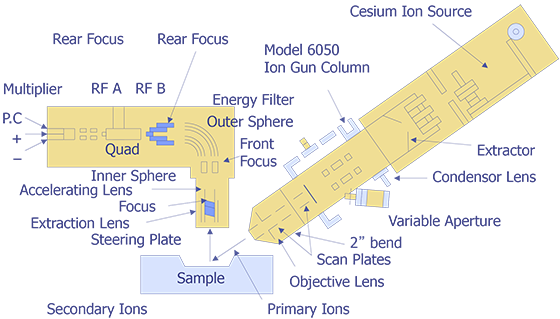
Figure 2 illustrates the ion beam-sample interactions and Figure 3 displays a typical instrumental arrangement of the primary ion source and the mass analyzer. Comparing relative ion yields in sample depth profiles to those of ion implanted reference samples in the same matrix enables an approximate quantification. The current density of the primary ion beam may be varied over several orders of magnitude to produce sample milling rates ranging from a few angstroms per minute to several thousand angstroms per minute. This property makes the technique a powerful surface analysis, bulk analysis, thin film characterization, and depth profiling tool. Minimum ion beam spot sizes are on the order of 2-5 µm, thus limiting the lateral imaging resolution achievable with the primary ion sources to similar dimensions. However, SIMS is not useful for small areas. Data must be taken over much larger plastered areas in order to obtain any reasonable detection limit. Some instruments can analyze small areas for larger concentrations, such as in particle analysis, but dopant concentrations cannot be measured from an area of the same order of dimension as the spot size.
SIMS is used to evaluate dopant profiling and trace contamination of surfaces, thin films, thick films, multilayer structures, and interfaces. It is used to measure relative levels of incorporated impurities or component elements as a function of processing parameters, correlation of trace ionic contaminant levels to electrical leakages, and mapping of impurities for correlation to device to device geometrical features. Samples must be compatible with the ultra-high vacuum (approximately 10-10 Torr) of the SIMS analytical chamber that is required to prevent reabsorption of sputtered species and permanent gases onto freshly ion milled sample surfaces.
SIMS equipment is quite complex and expensive. Considerable expertise is also needed to interpret SIMS spectra and depth profiling charts. Typically, an expert in the field of ion implantation physics is necessary to operate and interpret the data from SIMS analysis. As the failure analyst, you will normally provide the sample and pertinent background information to the SIMS operator and he or she will perform the analysis for you. Because SIMS equipment is quite expensive (in excess of $1 million), you will most likely send the samples to your corporate analytical laboratory or to an outside service.
The following are some factors that affect the quality of the data from SIMS:
Primary Beam Species - The choice of species affects the positive or negative secondary ion yield enhancement. For example O2+ enhances positive ion yield, while Cs+ enhances negative ion yield. Selecting which ion species to use depends on whether positive or negative ion yield is favored for the impurity to be analyzed.
Primary Beam Energy - The choice of primary beam energy affects depth resolution, secondary ion yield, and the sputtering rate. For instance, depth resolution degrades as the primary beam energy is increased. Secondary ion yield tends to increase with primary beam energy, however, Cs+ is an exception and O2+ remains almost constant (see Figure 3). Sputtering yield increases as the primary beam energy increases, although it tends to saturate at higher accelerating potentials (see Figure 4).


Primary Angle of Incidence - Sputtering increases as the angle of incidence increases (see Figure 5), but secondary yield decreases as the angle of incidence increases (see Figure 6). Depth resolution tends to increase along with the angle of incidence because differential sputtering is lower and the decay length for the ionized species decreases.
Sputtering Rate - Sputtering rate increases linearly with increasing beam current and decreases inversely as the square of the rastered area. The sputtering rate also depends on the mass, energy, and angle of incidence of the primary ions, the mass of the sample atoms, and the surface binding energy of the sample.
Detected Area - The detected area should be only a small fraction of the crater area to avoid crater sidewall contributions. In a depth profile, the total sputtered crater cannot be used for the depth profile data because of contributions from the sidewalls. As a rule of thumb, the sputtered crater should be at least 2.5 times the width and length of the area of interest for depth profiling.
Species Monitored - The choice for impurity species for analysis is usually concerned with detection limits, but also involves sensitivity and dynamic range. The best detection limit can be found with knowledge of the mass interferences and the relative sensitivity factors for atomic and molecular ions. The use of rarer isotopes for analysis can be an aid.
End Point - The ability to know when to stop a profile is important and depends on the analyst's knowledge of the typical background level, the sputtering rate, and the sample.
Energy Distribution - The secondary ion energy distribution varies with element, wth molecular versus atomic ion, and with sample charging during analysis of insulators. The choice of energy acceptance window can affect the accuracy of the profile and detection limit.
Ion Beam Mixing and Depth Resolution - Ion beam mixing defects on primary beam energy, species, and the angle of incidence. Depth resolution is affected by ion beam mixing. Decay length and interface width are also important.
Segregation and Charge Driven Diffusion - Movement of an analyte species, such as As in SiO2, can occur during ion bombardment because of chemical gradients. Charge-driven diffusion can distort the profile of some elements, such as Na.
Matrix Effects - Secondary ion yields can vary with sample composition. The most frequently encountered matrix effects are caused by changes in the oxygen atom density of the sample.
Surface Effects - The native oxide, the equilibration depth, and surface defects produce depth profile aberrations. The equilibration depth can be reduced with analysis at lower primary beam energy or with the use of an oxygen leak. The equilibration depth can be zero for the analysis of oxides using an oxygen primary beam. Surface defects can be avoided by optical examination of the area to be analyzed.
Particulates - Surface or buried particulates can distort a profile. Sometimes this problem can be corrected by using what is known as selective area analysis.
Crater Shape - Crater shape and bottom flatness affect the depth resolution of a profile.
Microtopography - Topography changes can occur during ion bombardment. The quantification and depth resolution of the proflie can be affected. It is important to determine the onset depth of microtopography in a given matrix in order to understand its effect on the profile.
Memory Effect - The memory effect, especially on a magnetic sector instrument, can limit the dynamic range of the instrument to about 5 orders of magnitude. This can result from two scenarios: one, the effect of analyzing a sample matrix that is the contaminant species for a subsequent profile (heteromemory), and two, the analysis of a high concentration of a species in a depth profile where a good detection limit for that same species is desired (homomemory).
Count Rate Saturation - Faraday cup and/or electron multiplier saturation during a profile can cause distortion of the profile, including flattening of the peak or a dip at the peak.
Sample Location and Mounting - The sample position for a magnetic sector instrument can affect the ion transmission through the mass spectrometer. If at all possible, the entire analysis should be performed at one location to ensure the highest levels of accuracy. The distance from sample to analyzer can also affect the data.
Mass Interferences - Mass interferences cannot always be predicted. These intereferences can be understood in greater detail by using high mass resolution and voltage offset techniques to deconvolve the data. Unfortunately, some sensitivity is lost as a result.
Procedure - A Relative Sensitivity Factor (RSF) is a conversion factor from secondary ion intensity to atom density. The RSF is defined by the equation:


where ρi is the impurity atom density in atoms/cm3, Ii is the impurity isotope secondary ion intensity in counts/s, Im is the matrix isotope secondary ion intensity in counts/s and RSF has units of atoms/cm3
From this definition, it can be noted that the RSF of the matrix is equal to its atom density. An RSF can be determined from an ion implanted calibration sample with a constant background ion intensity by the expression:


where Φ is the ion impant fluence in atoms/cm3, C is the number of measurements or data cycles, EM/FC is the ratio of electron multiplier to Faraday cup counting efficiency (used only when the matrix is measured on the FC and the impurity on the EM), d is the crater depth in cm., ΣIi is the sum of the impurity siotope secondary ion counts over the depth profile, Ib is the background ion intensity of Ii in counts/data cycle and t is the analysis time in s/cycle for the species of interest.
Calibration Using Ion Implantation - Ion implanted samples can serve as a standard for SIMS calibration. More than one isotope can be implanted, provided the fluences of all isotopes can be determined. The choice of the best isotope should be based on interferences and isotope abundance. The energy of the implant should carry the peak and at least some of the front side of the implant profile deeper than the equilibration zone. The optimum fluence requires not implanting a fluence that will cause detection saturation, but enough fluence to allow more than one order of magnitude of detection above background.
Systematic Trends in Relative Sensitivity Factors - The factors affecting RSFs can be quite complex; however, there are some general trends that are worth noting. RSFs change with respect to both ionization potential and electron affinity (see Figure X and Y). For more detailed information, consult RSF tables (e.g. Appendix E in Wilson et.al.)


Bulk Analysis - Bulk analysis can be achieved by sputtering at a very high rate. Mass spectra can be used to produce quantitative results with the use of RSF values.
Metals and Rough Surfaces - Analysis of metals is difficult because of microtopography formation, inclusions, non-uniform chemistry, grains, phases, and polycrystallinity, all of which affect depth resolution. Sample rotation can improve the analysis of metals.
Insulators - Electron beam neutralization allows the analysis of a wide range of materials. The entire ion beam rastered area must be flooded with electrons to produce good results.
Interfaces - SIMS analysis of an interface will show a width greater than the actual width. The derivative of the SIMS signal should have a Gaussian shape, and the interface width is defined as the distance between the +/-1s widths. The most common method for determining the depth location of an interface is the point at which the intensity of the species drops to 50% of its maximum value.
Multilayers - Changes in secondary ion yield across multilayer structures (such as quantum well devices) can affect analysis.
Residual Gas Elements - Analysis of residual gas elements (H, C, N, O) with higher sputtering rates typically produces a better detection limit.
Small Areas - Analysis of small areas, particularly on patterned wafers, is difficult.
Major Elements - SIMS profiling of major constituents can supplement what Auger electron spectrometry can provide, but at a faster rate.
| Z Element | O2 or Cs | Ion | Comments or Optional Ions |
|---|---|---|---|
| 1 H | Cs | H- | 2H if impant |
| 2 He | O2 | He+ | No for HeCs+ |
| 3 Li | O2 | Li+ | |
| 4 Be | O2 | Be+ | HMR if in AlGaAs(Al3+) |
| 5 B | O2 | B+ | B- will work w/Cs |
| 6 C | Cs | C- or | CM- (better) 13C if implant |
| 7 N | Cs | NM- | N+ w/O2 15N if implant |
| 8 O | Cs | O- | 18O if implant |
| 9 F | Cs | F- | |
| 10 Ne | O2 | Ne+ or | NeCs+ w/Cs 22Ne if implant (Ar2+, Ca2+) or HMR |
| 11 Na | O2 | Na+ | |
| 12 Mg | O2 | Mg+ | |
| 13 Al | O2 | Al+ | Al- will work w/Cs (AlGaAs) |
| 14 Si | Cs | Si- | 30Si if implant (GaAs, e.g.) |
| 15 P | Cs | P- or | PM-(+) HMR in Si (30SiH) |
| 16 S | Cs | S- | HMR (O2) or 34S 34S if implant |
| 17 Cl | Cs | Cl- | |
| 18 Ar | O2 | Ar+ or | ArCs+ w/Cs |
| 19 K | O2 | K+ | |
| 20 Ca | O2 | Ca+ | |
| 21 Sc | O2 | Sc+ | |
| 22 Ti | O2 | Ti+ or | Ti- w/Cs |
| 23 V | O2 | V+ or | V- w/Cs |
| 24 Cr | O2 | Cr+ | |
| 25 Mn | O2 | Mn+ | no Mn- ion |
| 26 Fe | O2 | Fe+ | HMR in Si 54Fe if implant |
| 27 Co | O2 | Co+ | HMR in Si |
| 28 Ni | O2 | Ni+ | Ni- w/Cs HMR in Si |
| 29 Cu | O2 | Cu+ | Cu- w/Cs |
| 30 Zn | O2 | Zn+ | ZnCs+ w/Cs |
| 31 Ga | O2 | Ga+ | |
| 32 Ge | Cs | Ge- or | Ge+ w/O2 HMR or 70Ge in Si HMR in GaAs(As) 70Ge if implant |
| 33 As | Cs | AsM- or | As- HRM or offset V if As- in Si |
| 34 Se | Cs | Se- | |
| 35 Br | Cs | Br- | |
| 36 Kr | O2 | Kr+ or | KrCs+ w/Cs |
| 37 Rb | O2 | Rb+ | |
| 38 Sr | O2 | Sr+ | |
| 39 Y | O2 | Y+ | |
| 40 Zr | O2 | Zr+ | |
| 41 Nb | O2 | Nb+ | |
| 42 Mo | O2 | Mo+ | |
| 44 Ru | O2 | Ru+ or | Ru- w/Cs |
| 45 Rh | O2 | Rh+ or | Rh- w/Cs |
| 46 Pd | O2 | Pd+ or | Pd- w/Cs |
| 47 Ag | O2 | Ag+ or | Ag- w/Cs |
| 48 Cd | O2 | Cd+ or | CdCs+ No Cd- ion |
| 49 In | O2 | n+ | offset V in Si |
| 50 Sn | O2 | Sn+ or | Sn- w/Cs |
| 51 Sb | Cs | Sb- or | SbM- |
| 52 Te | Cs | Te- | |
| 53 I | Cs | I- | |
| 54 Xe | O2 | Xe+ | No XeCs+ w/Cs |
| 55 Cs | O2 | Cs+ | |
| 56 Ba | O2 | Ba+ | HMR or offset V in GaAs |
| 57 La | O2 | La+ | |
| 58-71 | Lanthanide rare earths - same as La- | ||
| 72 Hf | O2 | Hf+ | No Hf- ion |
| 73 Ta | O2 | Ta+ | |
| 74 W | O2 | W+ | |
| 75 Re | O2 | Re+ | |
| 76 Os | Cs | Os- or | Os+ w/O2 |
| 77 Ir | Cs | Ir- | |
| 78 Pt | Cs | Pt- | |
| 79 Au | Cs | Au- | |
| 80 Hg | O2 | Hg+ or | HgCs+ w/Cs No Hg- ion |
| 81 Tl | O2 | Tl+ | |
| 82 Pb | O2 | Pb+ | HMR or offset V in GaAs |
| 83 Bi | Cs | Bi- or | BiM- or Bi+ w/O2 TaSi interference, so use non-Ta extractor |
| 90 Th | O2 | Th+ | |
| 92 U | O2 | U+ |
SIMS is a destructive step, much like the Focused Ion Beam cross section, and, as such, should be performed at the end of the analysis after all electrical data and fault isolation. SIMS is not a normal procedure for a one of a kind field return. SIMS is more commonly used to aid in yield analysis or yield improvement activities where a number of samples are available. SIMS depth profiling tends to work best on large area test structures where SIMS data is more accurate.