System Maintenance occurs every Friday.
System Maintenance occurs every Friday.
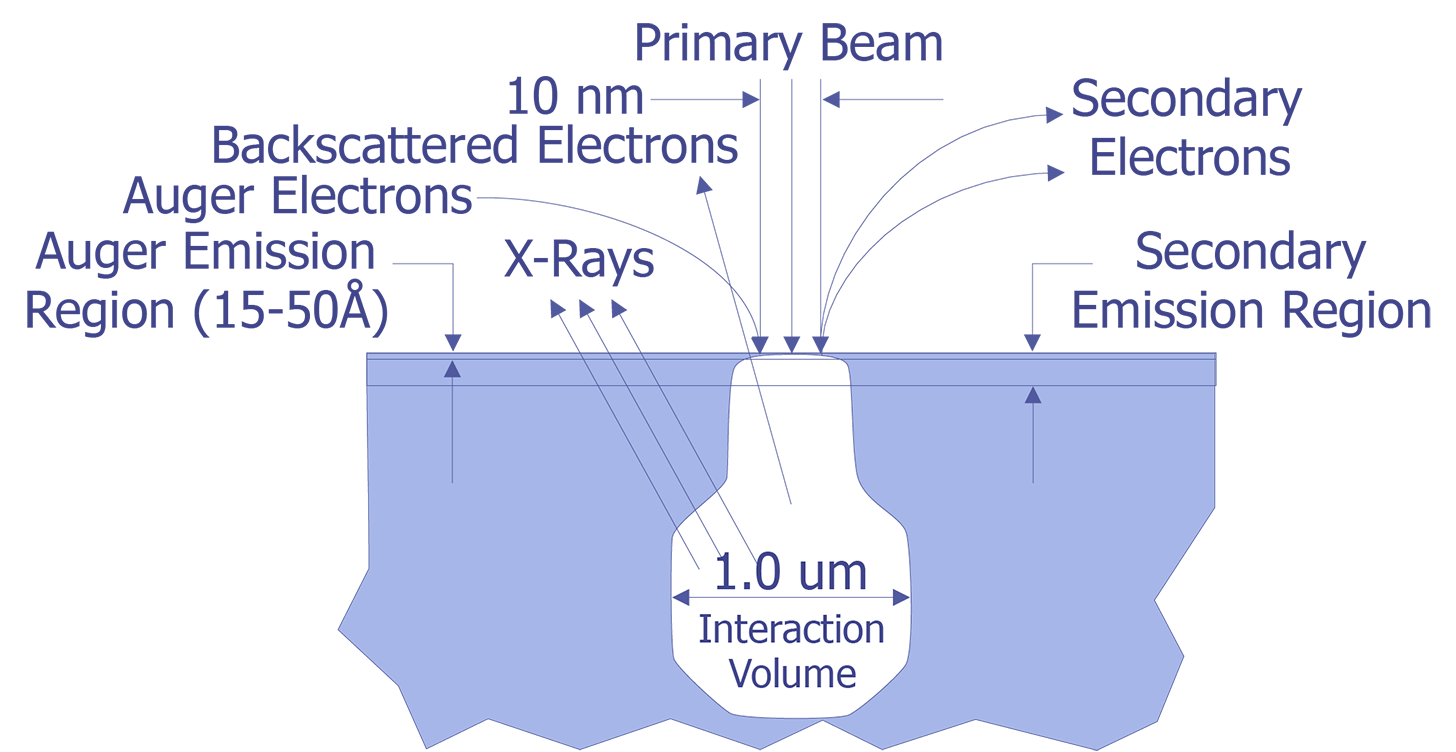
Auger Electron Spectroscopy (AES) is a surface science technique that uses the Auger electrons emitted from an electron beam interaction with the sample to determine elemental information about the surface of the sample. AES is named after the French physicist Pierre Auger, who properly identified the electron emissions noted in early electron microscope work. The Auger electrons are typically very low energy (< 2000 volts). These electrons can only escape from the top 50Å of the sample (see Figure 1). This makes AES an ideal tool for examining the surface.
Like its cousin EDS (Energy Dispersive X-ray Spectroscopy),AES relies on the primary electron beam interacting with orbital electrons in the sample to generate a signal. When the electron beam strikes the sample, the incident electrons can knock orbital electrons into higher states. When these electrons decay back into the lower state, either an x-ray can be emitted (basis for EDS), or the decay can kick an Auger electron out from the atom (basis for AES)(see Figure 2.). These electrons have a low energy and thus a very small mean free path (10-50Å). Because of this, only Auger electrons from the top 10-50Å are emitted from the sample.
The Auger electrons that do escape the sample can be collected and analyzed. The energy levels can be quantized to produce a spectra. Auger electrons have characteristic energies depending on the orbital decay and atomic species (see Figure 3). These characteristic energies can be identified, providing the analyst with identification of the sample material. Like EDS, Auger Electron Spectroscopy provides identification of elements, but does not allow for good quantitative analysis. Without standards, the accuracy is on the order of 50%; with standards, the accuracy is on the order of 10%. AES provides sensitivity in identification to approximately 0.1%, depending on the element, sample, and accelerating voltage. The lateral spatial resolution of Auger Electron Spectroscopy is quite good. A Field Emission (FE-Auger) system can provide submicron lateral spatial resolution, making it the tool of choice for element identification in small particles.


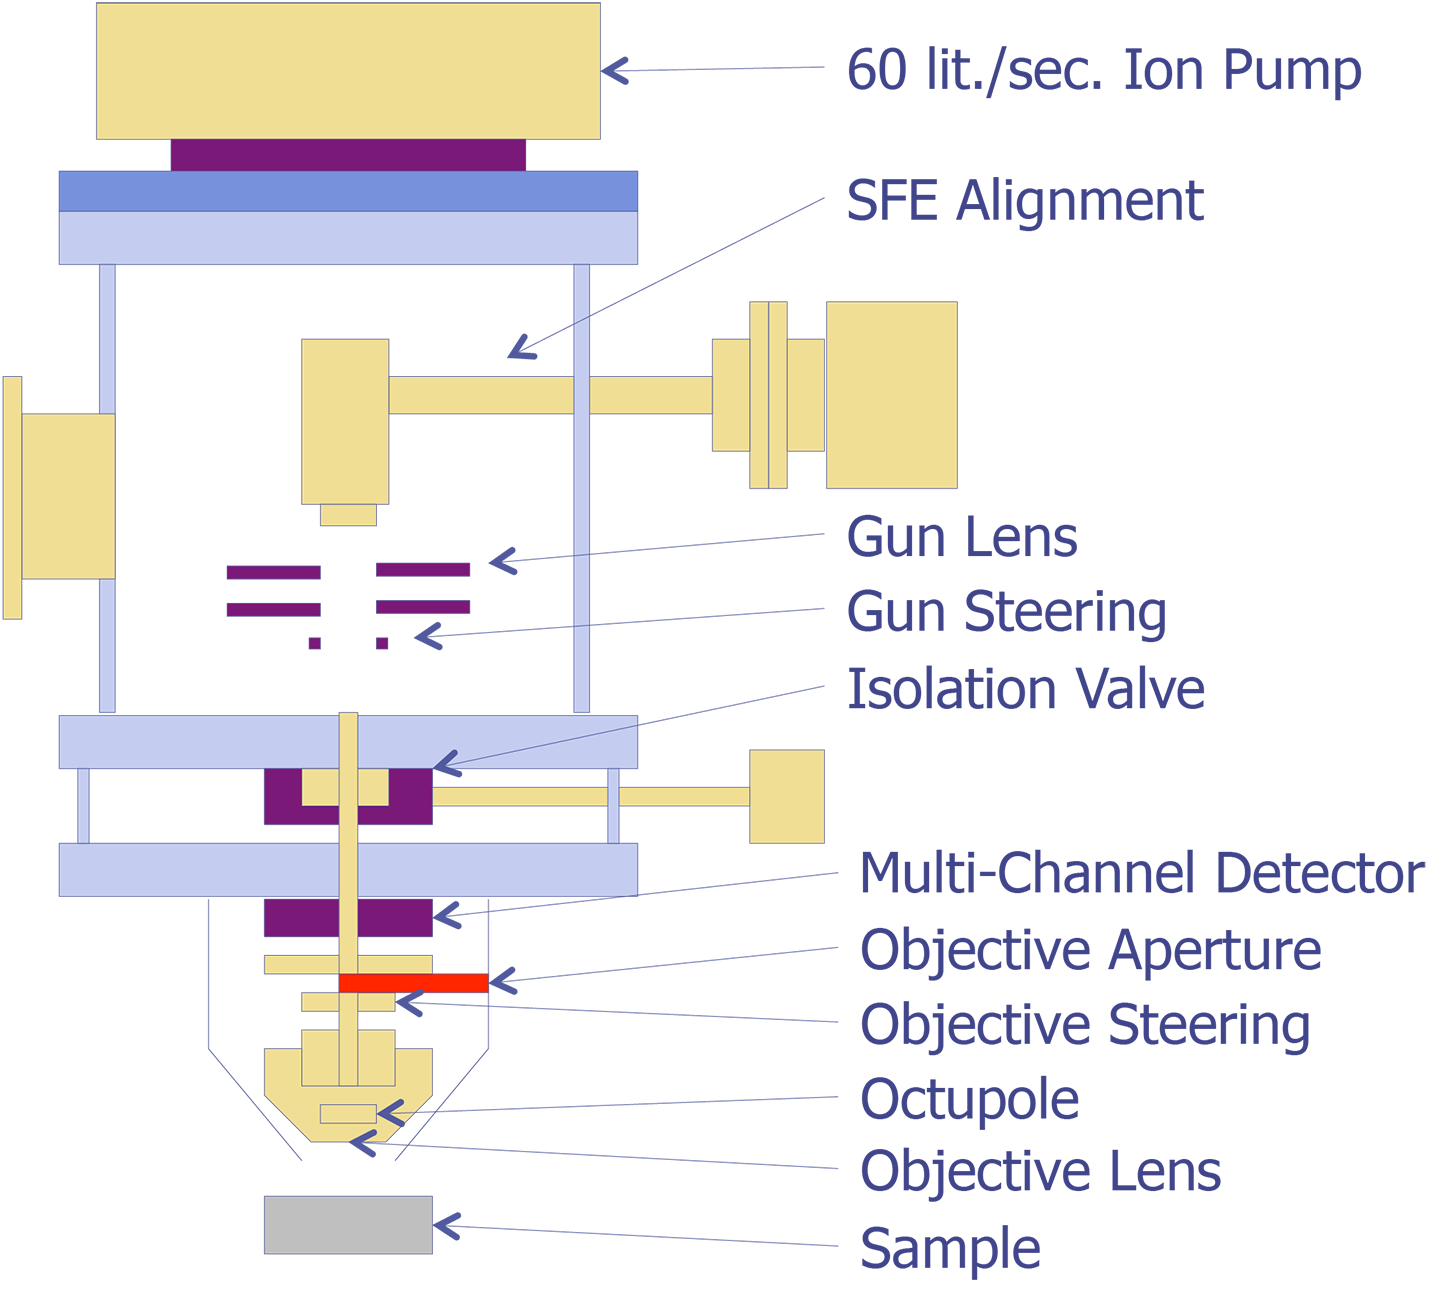
The basic elements of an Auger instrument are shown in Figure 4. Because freshly sputtered surfaces oxidize readily even at relatively low pressures, the system must be kept under high vacuum (less than 5 x 10⁻⁹torr). The low pressure allows the analyst to obtain a more accurate analysis of the surface. At higher pressures, the data would indicate an excessive amount of oxygen.
Most Auger systems are capable of performing depth profiling-- examining the composition of a material as it is milled away. An ion milling process sputters material from the location of interest, while Auger analysis is performed on the surface of the bottom of the sputtered crater.
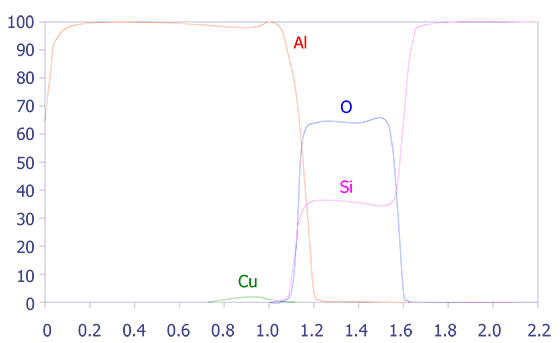
One problem with depth profiling in a Auger system is that the ion milling can sometimes occur unevenly, leading to a phenomenon known as differential sputtering. This effect is minimal on materials such as deposited aluminum, but it can be severe on materials such as Mercury-Cadmium-Telluride. This effect is also manifested as a stretched depth profile (see Figures 5 and 6). The main method for reducing this differential sputtering is a technique called Zalar rotation. Zalar rotation is a technique whereby the sample is continuously pivoted to prevent ion channeling and, hence, differential sputtering.


In summary, Auger Electron Spectroscopy has excellent spatial resolution (150Å), reasonable detection limits (< 0.5 atomic percent), good quantification with standards, and excellent speed. The main limitation of Auger Electron Spectroscopy is its diminished ability to analyze insulators. Some insulators, especially silicon nitride, are very difficult to analyze.
Auger Electron Spectroscopy is the tool of choice for surface (top 50A) analysis. The tool provides identification of elements from Lithium through Uranium with sensitivities on the order of 0.1%. Auger is the best tool for surface contamination analysis (i.e. contamination in the native oxide). The analyst can perform Auger depth profiling coupled with an Ar sputtering beam. Auger analysis is also a powerful tool for small particle analysis. Auger can have up to a factor of 10 better lateral resolution than EDS and complete selectivity to the surface.
Auger Electron Spectroscopy is a fairly common technique, but not nearly as common as EDS. Some degree of expertise is necessary to interpret Auger spectra and elemental maps. Typically, a knowledgeable physicist is best suited to operate and interpret the data from Auger analysis. As the failure analyst, you will normally provide the sample and pertinent background information to the Auger operator, and he or she will perform the analysis for you. Because Auger equipment is expensive (approximately $800k for a good FE-Auger system), you will send the samples to your corporate analytical laboratory or to an outside service.
We are currently working on uploading information to this section.
Auger Spectra are usually displayed as the number of counts at a particular energy N(E) versus energy, or as a derivative D(N(E)). The first method is called the Direct Spectrum, while the latter method is called the differential spectrum. Historically, the differential spectrum was difficult to produce. However, with today's computing technology, the differential spectrum is trivial to create (automated in software on most machines). Although the differential spectrum makes peak identification easier, it introduces the need for relative sensitivity factors and resolution factors. On newer machines with better energy resolution, differential spectra are usually not necessary. Newer machines have hemispherical mass analyzers similar to those of SIMS machines, allowing for very accurate energy sensitivities. The equation for determining the Auger electron current, which in turn provides information about the spectrum, is shown below:


In the above equation, IO is the primary electron beam current, sA is the ionization cross section, EP is the primary electron beam energy, rM is a backscattering term (dependent on the matrix M, in which the atoms of interest are embedded), a is the angle to the surface normal of the incident electron beam, T is the transmission efficiency of the electron spectrometer, D is the efficiency of the electron detector, NA(z) is the distribution of the atoms of interest with respect to depth z into the sample surface, l is the inelastic mean free path in the matrix (before being inelastically scattered), and q is the angle of emission to the surface normal.
Obviously, this formula is too difficult to solve empirically, so various parameters are determined experimentally. Graphs covering the energy dependence of s with respect to EP, rM with respect to EA, atomic number Z and a (angle of incidence) have been experimentally determined, as well as the dependence of l on electron energy.
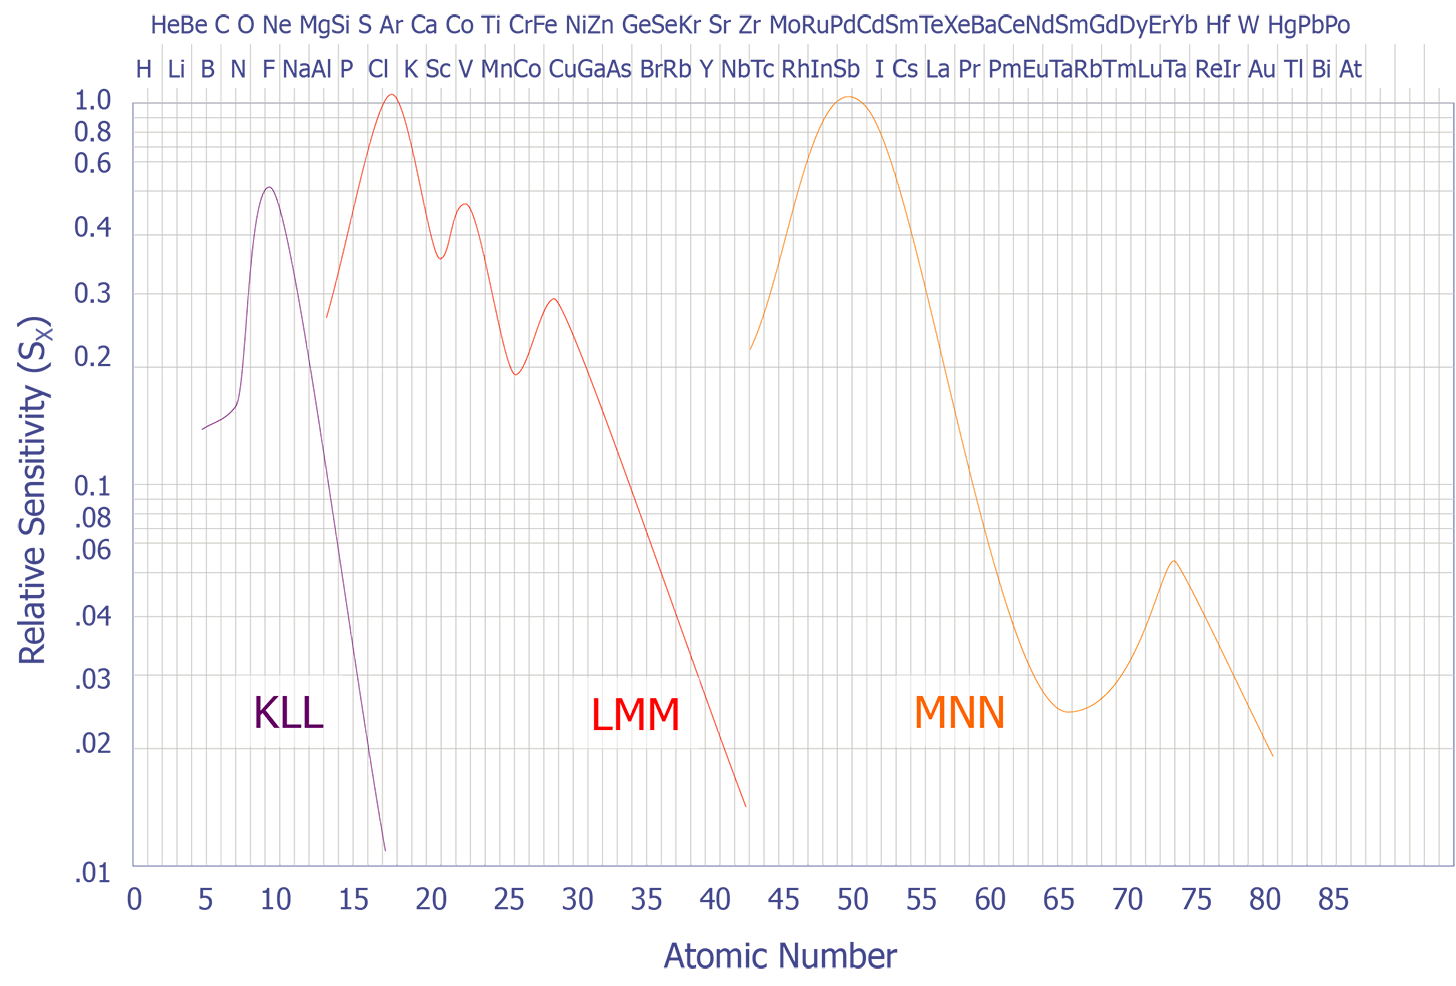
If the peak to peak value is measured in the derivative energy spectrum, then relative sensitivity factors must be used. A set of these sensitivity factors is shown below (see Figure 7). A final correction must be performed if the analyzer resolution and modulation are relaxed. Anthony and Seah experimentally derived a universal curve of intensity of singlet peaks versus modulation voltage (see Figure 8).


With these things in mind, one can now make some general statements about the shapes of peaks given various conditions. For example two spectrometers, one with resolution below 0.5% and the other above 1.0%, can cause dramatic changes in the intensity of particular elements (use Fig. 5.9). The curve in Figure 5.8 can be used to compare one to the other, and it can be demonstrated that they match quite closely. The nature of the chemical bond can also cause changes in the spectra. For example, a bond with higher electronegativity will create a broader peak and lower the energy (use Fig. 5.10). Although this work is now performed by computers, a good understanding of the fundamental aspects of Auger spectra interpretation is still useful for the failure analyst when examining Auger spectra.
Auger Electron Spectroscopy is normally a non-destructive technique. However, like EDS, some radiation damage can result from the 5-30 keV electron beam. Most of this damage is annealable by a low temperature bake for several hours. However, because of the sputtering involved, Auger depth profiling is a destructive technique. Standard AES can be performed in conjunction with EDS during the analysis process flow. Auger depth profiling should be performed at the end of the analysis process flow, much like cross-sectioning or SIMS.