System Maintenance occurs every Friday.
Biased temperature stress is an analysis technique performed by subjecting the component to elevated temperature with electrical bias applied to the component. The electrical bias may be applied in one of several general ways, including the following two conditions:
(1) Powering up the component with appropriate potentials for VDD, VSS, and unchanging logic levels for the inputs and I/O pins (this is sometimes referred to as static bias and may also referred to as the static burn-in bias configuration, since this has been commonly used for burn-in).
(2) Powering up the component with appropriate potentials for VDD, VSS, and sequentially changing logic levels for the inputs and I/O pins (this is sometimes referred to as dynamic bias). The set of logic conditions for the inputs and I/O pins are often called the input stimulus or test vectors.
An unbiased bake is an analysis technique performed by subjecting the component to elevated temperature without electrical bias applied to the component.
Biased temperature stress is performed to determine if the failure mode or mechanism of the component will change due to exposure of the component to elevated temperature with electrical bias applied. This response of the device to the biased temperature stress can provide useful information about the failure and what analysis steps to take next.
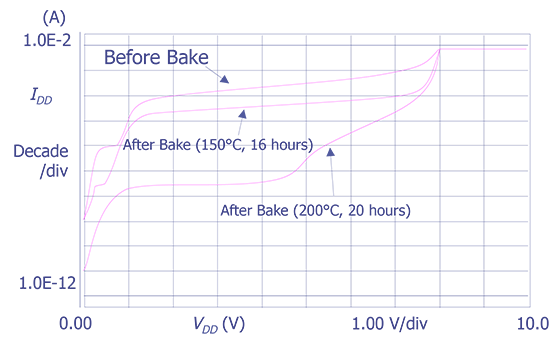
An unbiased bake is performed to determine if the failure mode or mechanism of the component will change due to exposure of the component to elevated temperature without electrical bias applied. This response of the device to the unbiased bake can provide useful information about the failure and subsequent analysis steps.
A biased test stress is performed by placing the component into an appropriate high temperature chamber for a period of time with electrical bias applied to the component. Typical temperatures range from 125 to 200 degrees centigrade, and times commonly used range from a few hours to a few tens of hours. The temperatures and times selected should be appropriate for the type of component package to avoid damaging the component or introducing failure mechanisms not already present. The bias conditions should also be chosen to be compatible with the design and fabrication limitations of the component technology. After exposure to the elevated temperature and electrical bias conditions, the component is retested to determine if the original failure symptoms still exist or have changed.
An unbiased bake is performed by placing the component into an appropriate high temperature chamber for a period of time without applying electrical bias. Typical temperatures range from 125 to 200 degrees centigrade, and times commonly used range from a few hours to a few tens of hours. The temperatures and times selected should be appropriate for the type of component package to avoid damaging the component or introducing failure mechanisms not already present. After exposure to the elevated temperature, the component is retested to determine if the original failure symptoms still exist or have changed.
A biased temperature (BT) stress period may be performed early in the analysis process or may be used after an unbiased bake. If an unbiased bake produces partial or complete recovery of the electrical failure symptoms, it is appropriate to consider the use of BT stress to attempt to reproduce the original failure condition. Reproducing the original failure condition will add confidence and additional information for the identification of root cause of failure.
An unbiased bake is usually performed during the early phase of analysis to determine the stability and repeatability of the failure mode or symptoms. An unbiased bake is particularly appropriate if it is suspected that the root cause of failure may involve ionic contamination or other bias-temperature stress instability mechanisms, such as those accelerated by burn-in, life test, or similar type of reliability test. Alternatively, an unbiased bake can be a very effective and normally benign method of eliminating a number of possible failure mechanisms.


