System Maintenance occurs every Friday.
System Maintenance occurs every Friday.
In general, there are several ways to measure the temperature of an object [1-6]. The simplest method is measure the radiance and, if the emissivity of the material is known, directly compute the temperature of the sample. Systems of this type use a very simple photovoltaic type detector that is sensitive in the IR wavelengths. Cooled InSb photovoltaics are perhaps the most common. These detectors are generally sensitive in the 1.5 µm to 5.5 µm range.
To directly measure the temperature of a sample, the radiance is measured first. The radiance from a sample at a given temperature is related to the radiance from a blackbody at the same temperature by the emissivity, or


where RT is the radiance from the sample, e is the sample's emissivity, and RTBB is the radiance of a blackbody at the same temperature. Ideally, if the sample's emissivity is known, its temperature can be calculated if the relationship between the radiance collected by a given system from a blackbody and its temperature is known.
In order to increase the accuracy of the temperature measurement, the radiance that is reflected by the sample must be accounted for. Thus, the total radiance collected by a system from a sample would be


where R0 is the radiance emitted by the ambient background. Combining the last two equations, the total radiance collected by the system is


If the emissivity is known and the ambient radiance can be accounted for, the temperature of the sample can be found.
Lastly, the spectral response of the system must be considered. In general, the system response will not be flat over the range on interest. The introduction of an "effective" blackbody radiance representing a convolution of the blackbody radiation spectrum and the IR microscope/detector response must be known. This information has usually been characterized by the manufacturer and is incorporated into their blackbody radiance to temperature conversion algorithm.
If the emissivity of the sample is not known, a comparison between the radiance measured from the unknown at a known temperature and from a blackbody can be performed. Measurements of this type can be easily done on uniform macroscopic samples; thus, measuring the temperature of VLSI integrated circuits is difficult, but not impossible.
More elaborate IR imaging systems have been developed to scan the sample and create a two-dimensional image of the surface radiance. Non-scanning systems simply add up the radiance from the entire field of view (or a pre-selected portion of it) and convert that radiance to temperature. Scanning systems allow surface temperature measurements to be made on samples with multiple areas of different emissivity values in the field of view. While the theory of operation is as before, calibration of the system requires that the user measure the radiance of the sample at two known temperatures using a sample stage heating unit. This measurement allows for the creation of an emissivity map of the sample surface over the temperature range of interest.
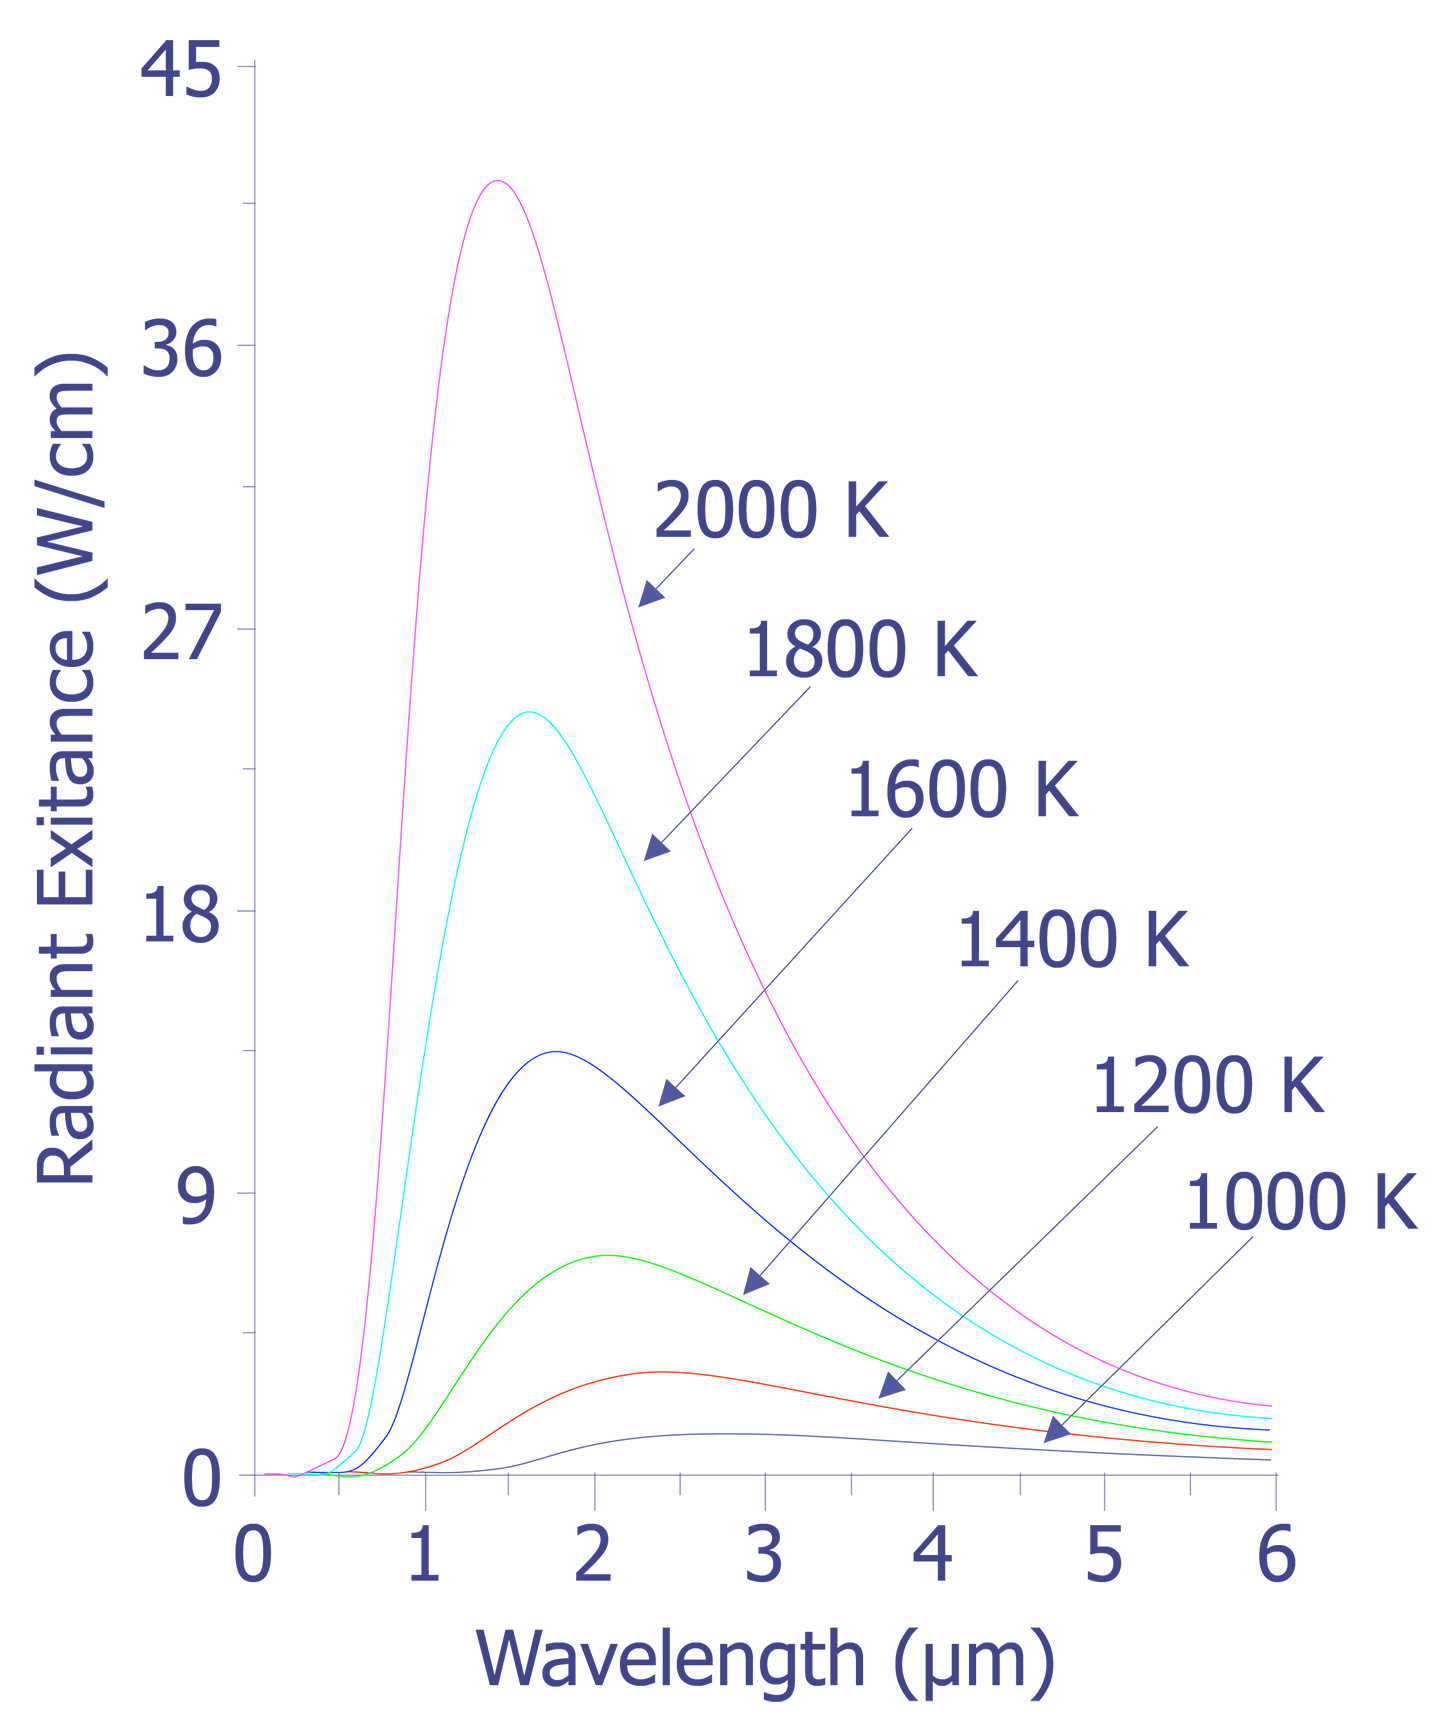
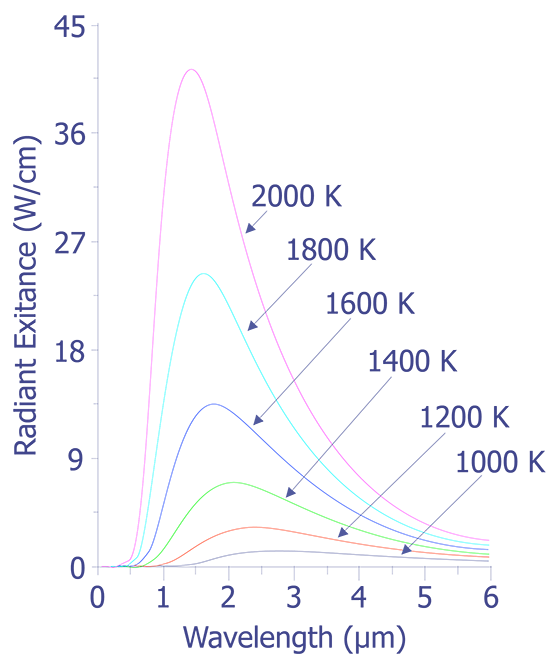
It is well known that heated objects emit radiation. Most of us have observed a red hot heating element on a stove or have looked at a red hot poker that has been withdrawn from a fire. Items such as these appear hot to us not because we felt the heat, but because we could see the radiation emitted by the object. As objects are heated beyond the red hot temperature, approximately 700 ºC, the amount of radiation being emitted in the visible range increases and the objects begin to turn orange, then yellow, and eventually to a bluish-white color. For example, the sun has a surface temperature of 5700 K and gives off a visible light with a peak around 510 nm. The North Star, by comparison, has a surface temperature of 8300 K and gives off radiation peaked at 350 nm. What is not readily apparent to us is that most of the light being emitted by hot objects is infrared. The spectral response of our eyes is well suited to the peak wavelengths being emitted by our sun.
The connection between the peak radiation wavelength and temperature forms the basis for infrared (IR) temperature measurement. Physicists in the late 19th century knew the relationship between the temperature of a blackbody-- a body that absorbs all of the radiation incident upon it-- and the peak wavelength of the radiation being given off by that body. However, they could not describe that relationship mathematically. The most important observation was that all blackbodies at the same temperature emitted radiation with the same spectral distribution, regardless of their composition. The spectral distribution of the radiation emitted by a blackbody is known as the spectral radiancy, RT(v), where n is the frequency of the radiation. The quantity RT(v) is defined so that RT(v)dv is the energy emitted per unit time in the frequency range v to v + dv from a unit area on a surface at temperature T.
The data plotted in this figure has been plotted as a function of wavelength instead of frequency as is described above. The integral of the spectral radiancy RT(v) over all frequencies is known as the radiancy, RT, or


In Fig. 2, it is evident that the radiancy increases with increasing temperature of the body. The relationship between the radiancy and temperature was first formulated in 1897 and is known as Stefan's Law,


Though Stefan's Law was defined empirically in its original form, the constant s came to be known as the Stefan-Boltzmann constant with a value of


Also evident from Fig. 2 is the relationship between the wavelength of maximum spectral radiance and temperature. It is evident that the peak wavelength decreases with increasing temperature. The relationship between wavelength peak and temperature is known as Wein's displacement law, which can be written,


where T is the temperature in degrees Kelvin. The result of the equation is ?MAX in meters.
Classically, if we consider a small hole in a cavity as an approximation of a blackbody, (this happens to be a very good blackbody), we can easily find the number of modes present in the cavity and assign an energy to each of these modes which should describe blackbody radiation. The following equations result if we realize that the spectral radiancy of a blackbody is directly proportional to that of a cavity,


and use the equipartition of energy theory where each mode of the cavity is assigned an energy.


This formula proved to be accurate at low frequencies, but failed miserably at high frequencies in the ultraviolet end of the spectrum. This theory was ultimately known as the ultraviolet catastrophe. The reason for the failure of this theory is simple. The equipartition theorem is only valid for a continuous distribution of energies. However, the energy of an electromagnetic wave is quantized in units of hn. The theory of energy quantization led Max Planck to the correct equation to describe the blackbody radiation spectrum:


In most applications, the object under examination will not be a perfect blackbody. As such, the radiancy will have to be corrected for the emissivity of the material. The emissivity, e, is defined through Stephan's Law, which relates the radiancy to temperature:


By definition, the emissivity of a material is the ratio of the energy radiated by a given object to the energy radiated by a blackbody at the same temperature. The emissivities of many materials have been measured and are generally available. Table 1 lists several common materials and their emissivity values.
| Material | Emissivity |
|---|---|
| Ideal black body | 1.0 |
| Lampblack | 0.95 |
| Asbestos paper | 0.95 |
| White Lacquer | 0.95 |
| Bronze paint | 0.8 |
| Carbon, rough plate | 0.76 |
| Oxidized steel | 0.7 |
| Polished brass, oxidized copper | 0.60 |
| Aluminum paint | 0.55 |
| Oxidized monel metal | 0.43 |
| Cast iron - polished | 0.25 |
| Copper - polished | 0.15 |
| Nickel - polished | 0.12 |
| Aluminum - highly polished | 0.08 |
| Platinum - highly polished | 0.05 |
| Silver - highly polished | 0.02 |
With current process technologies, feature sizes on integrated circuits have shrunk to the point where IR thermal systems cannot resolve single transistor dimensions. Another thermal imaging technology called Fluorescent Microthermal Imaging (FMI) is available to fill in where IR thermal imaging cannot. FMI is capable of achieving sub-micron spatial resolution while maintaining excellent thermal resolution. The two main references on this subject are listed at the end of this article.
Infrared thermal imaging has been used for many years in the microelectronics industry as a tool for measuring thermal distributions on macroscopic circuits. More recently, it has been applied to hybrids, thin film technologies, and integrated circuits primarily as a design tool for evaluation of heat flow processes.
For failure analysis of integrated circuits, IR thermal imaging is used in situations where excess current is being drawn by an IC and other diagnostic techniques such as light emission have failed to find anything. With current state-of-the-art technologies, IR thermal imaging does not have the spatial resolution needed to identify a single transistor as a problem. Because of the wavelengths of light used in the image formation process, the spatial resolution of IR thermal systems is generally about 15 mm at best. At least one equipment manufacturer has a system that claims under 5 mm spatial resolution. However, this technique can be used to guide the failure analyst to a small region on an IC and narrow down the possible problem areas to a small area on an IC.
Many common IC failure modes can create situations where excess current is drawn but no light emission is given off. An example is a metal to metal short, either on the same level or between two metal levels. For this type of failure, looking at the heat signature of the IC surface can quickly locate the problem. Other situations where the failure mode is package or heat sink/die attach related are ideal applications for IR thermal analysis.
The use of commercially available IR thermal equipment makes this technique straightforward to apply. Generally, scanning detector systems will be used for microelectronic failure analysis, as they are the most commonly available systems that can create 2-D surface temperature maps of small objects. Photovoltaic systems only give the temperature of a single spot on the device under examination. Array detector systems have not yet reached the commercial marketplace in any significant quantities.
To use a scanning detector type IR thermal system, perform the following steps:
Commercially available IR thermal systems will lead you through the setup and calibration steps (steps 3-5) and do all of the calculations via computer. The system will store the emissivity map in memory and use it for temperature calculations.
IR thermal imaging should be used for suspected thermal dissipation problems on packages, hybrids, or circuit boards or when an IC has an excess current problem that cannot be understood via light emission analysis or other means.